前言
业务中是否经常遇到服务器负载过高问题,或者经常碰到后台服务挂掉,却没有自动提醒功能,因此搭建一套监控报警系统势在必行。
Prometheus目前在开源社区相当活跃,在GitHub上拥有两万多Star,是当前最流行的监控系统,相比Zabbix,定制灵活度更高,而且Prometheus在云环境、容器支持这块优势明显。
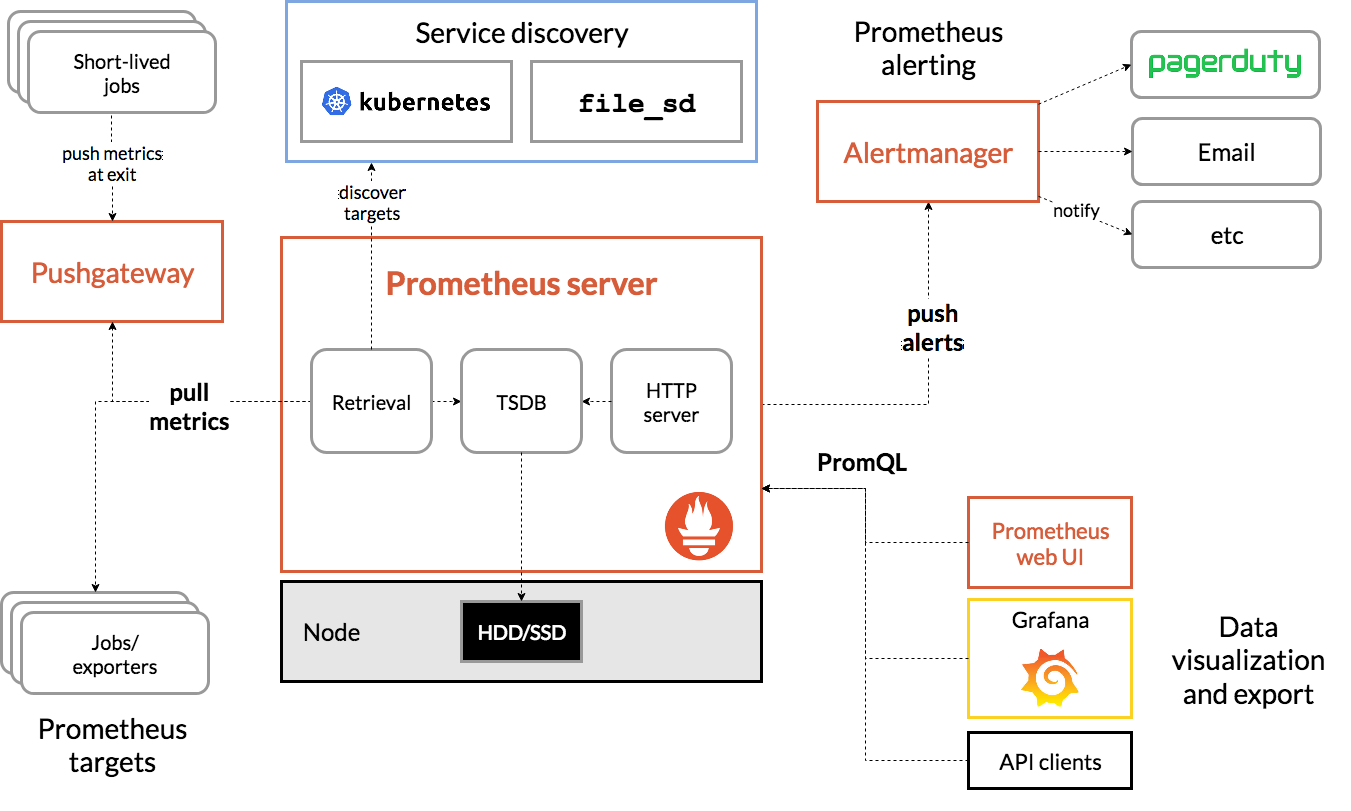
Prometheus 简介 Prometheus是一套开源的监控&报警&时间序列数据库的组合,基于应用的metrics来进行监控的开源工具。
下载&安装
1
2
3
4
5
6
7
8
9
10
11
12
13
14
15
16
17
18
19
20
21
22
23
24
25
26
27
28
29
30
31
32
33
34
35
36
37
38
39
# my global config global: scrape_interval: 15s # Set the scrape interval to every 15 seconds. Default is every 1 minute. evaluation_interval: 15s # Evaluate rules every 15 seconds. The default is every 1 minute. # scrape_timeout is set to the global default (10s). # Alertmanager configuration alerting: alertmanagers: - static_configs: - targets: - 192.168.88.69:9093 # Load rules once and periodically evaluate them according to the global 'evaluation_interval'. rule_files: - "test_rules.yml" # - "second_rules.yml" # A scrape configuration containing exactly one endpoint to scrape: # Here it's Prometheus itself. scrape_configs: # The job name is added as a label `job=<job_name > ` to any timeseries scraped from this config. - job_name: 'prometheus' # metrics_path defaults to '/metrics' # scheme defaults to 'http'. static_configs: - targets: ['192.168.88.69:9090'] - job_name: 'monitor' scrape_interval: 5s metrics_path: '/actuator/prometheus' static_configs: - targets: ['192.168.88.69:8008'] - job_name: 'node-exporter' static_configs: - targets: ['192.168.88.69:9100']
Spring Boot集成Prometheus 配置pom文件 1 2 3 4 5 6 7 8 9 <dependency > <groupId > org.springframework.boot</groupId > <artifactId > spring-boot-starter-actuator</artifactId > </dependency > <dependency > <groupId > io.micrometer</groupId > <artifactId > micrometer-registry-prometheus</artifactId > </dependency >
配置yml 1 2 3 4 5 6 7 8 9 10 11 12 13 server: port: 8008 spring: application: name: monitor management: endpoints: web: exposure: include: '*' metrics: tags: application: ${spring.application.name}
添加配置类 1 2 3 4 5 6 7 @Configuration public class MeterRegistryConfig @Bean MeterRegistryCustomizer<MeterRegistry> configurer (@Value("${spring.application.name}" ) String applicationName) { return (registry) -> registry.config().commonTags("application" , applicationName); } }
AlertManager 简介 Alertmanager 对收到的告警信息进行处理,包括去重,降噪,分组,策略路由告警通知。
配置 修改alertmanager.yml,当前配置的是邮箱告警,当然还支持企业微信、钉钉等,内容如下:
1 2 3 4 5 6 7 8 9 10 11 12 13 14 15 16 17 18 19 global: resolve_timeout: 5m smtp_smarthost: 'smtp.mxhichina.com:25' smtp_from: 'test@163.com' smtp_auth_username: 'test@163.com' smtp_auth_password: '123456' route: group_by: ["instance"] group_wait: 10s igroup_interval: 10s repeat_interval: 1h receiver: mail receivers: - name: 'mail' email_configs: - to: 'receiver@163.com' headers: {Subject: "告警测试邮件" }
启动 命令:./alertmanager & ,端口号:9093
Grafana 简介 Grafana是一款用Go语言开发的开源数据可视化工具,可以做数据监控和数据统计,带有告警功能。
配置
解压grafana-6.3.5.linux-amd64.tar.gz,启动 ./grafana-server &,访问地址http://192.168.88.69:3000
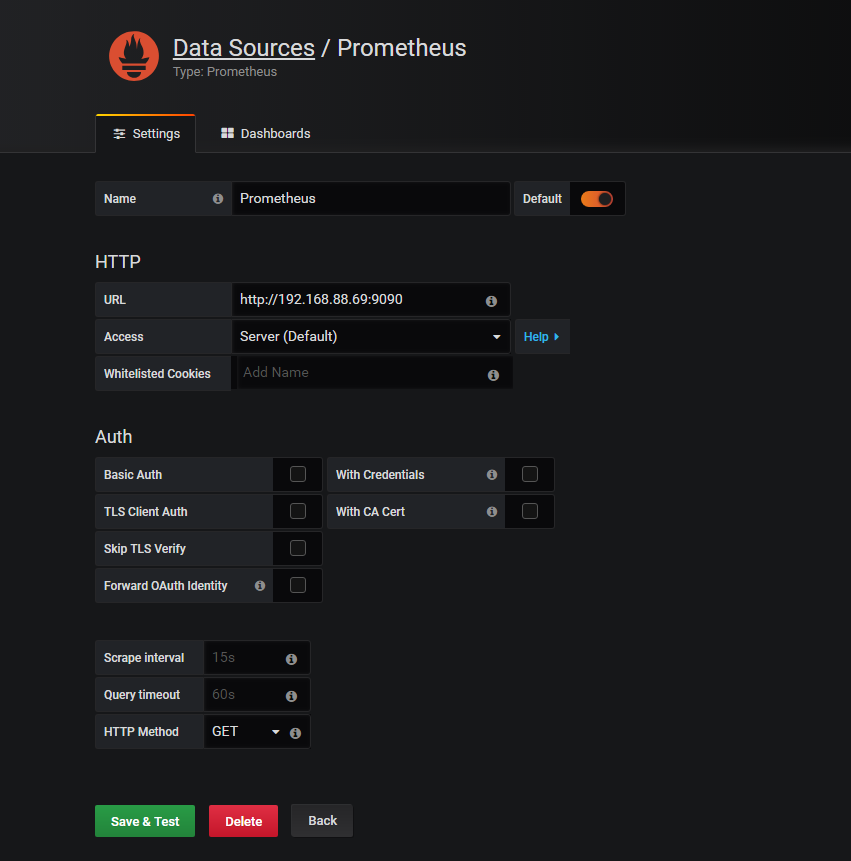
配置Data Sources
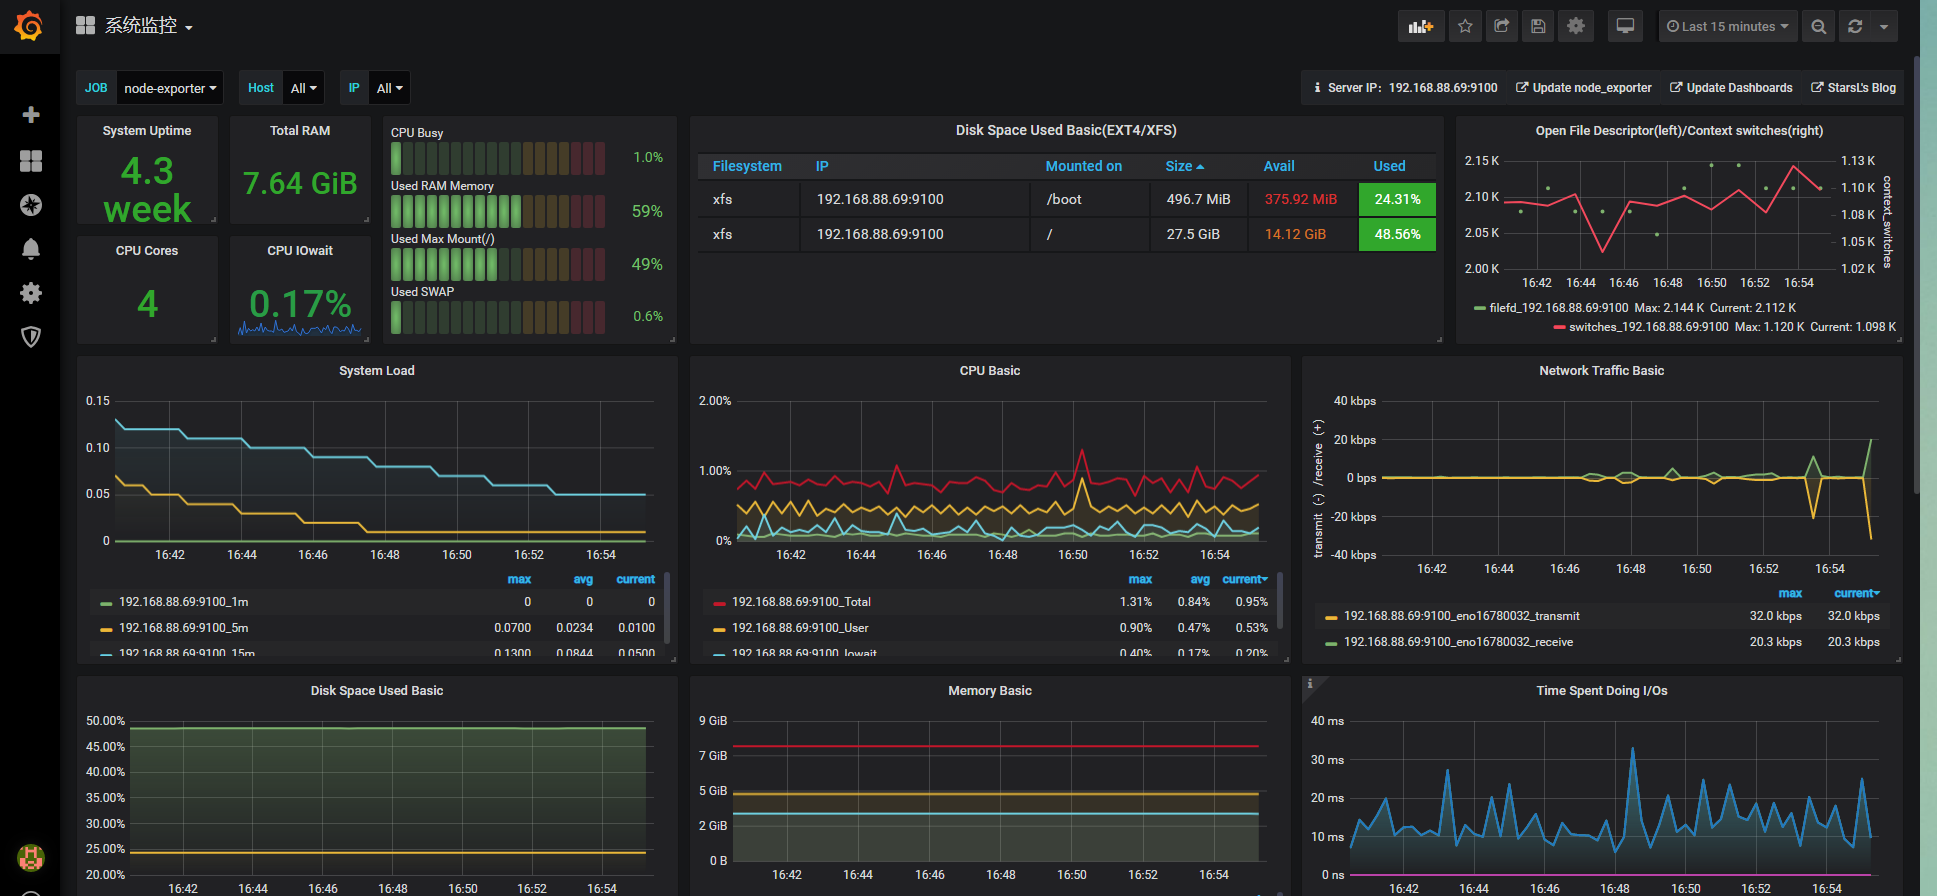
安装exporter,如要监控服务器的运行状态,需要安装node_exporter,并启动项目,端口号:9100,并在prometheus里配置节点,并重启prometheus。
导入模板,可以在Grafana官网找下,地址:https://grafana.com/grafana/dashboards 。